 |
 |
3.2. Position Keeping |
 |
|
Here we present some of the available screens for position and risk management.
|
|
 |
3.2.1. Spot Positions |
 |
|
A separate screen gives an up-to-date overview of currency pair based spot positions. It displays the last deals, the current position, as well as realised and potential profit/loss. The screen will be automatically updated.
Profits are losses are calculated using current using market rates, parameter rates and optionally a simulation rate. Scrolling keys allow a rapid navigation through the different currency pairs having spot positions. |
|
 |
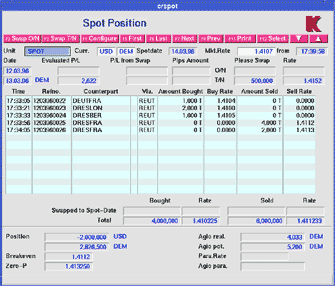 |
Picture 10: currency pair based spot position. |
 |
|
 |
|
The upper two lines indicate still open O/N and T/N positions from previous business days and the calculated P/L. These short positions can easily be swapped to spot date by a simple key stroke. This is shown in the picture below. |
|
 |
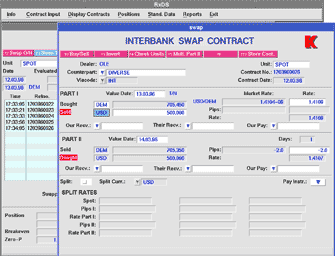 |
Picture 11: Swapping of an open T/N position. |
 |
|
 |
|
Hereby an accurate affiliation of arising P/L is granted. The swapping of open T/N positions can also be achieved automatically. This Auto-Swap feature is definable on the profit centre level. |
|
 |
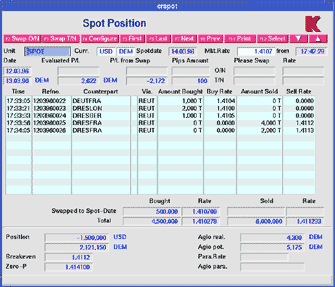 |
Picture 12: Spot position after successful T/N swap. |
 |
|
 |
|
The following screen of all currency pairs with current spot positions. |
|
 |
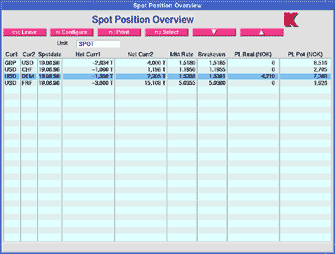 |
Picture 13: currency pairs with spot positions |
 |
|
 |
|
The column layout is freely configurable, so all important information can be displayed in one screen. Simple activation of a line opens the above mentioned screen "Spot Position" for a detailed view of the given currency pair position. Also this page is automatically kept up-to-date.
| |
 |
3.2.2. Forward Positions |
 |
|
This page gives an overview of current short positions for a profit centre. The open net amount, pips, daily pips and value date are shown. The average daily pips of all future positions are displayed. |
|
 |
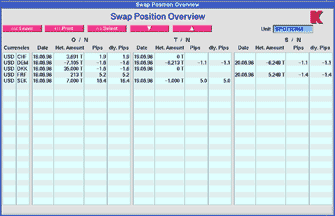 |
Picture 14: Swap positions overview |
 |
|
 |
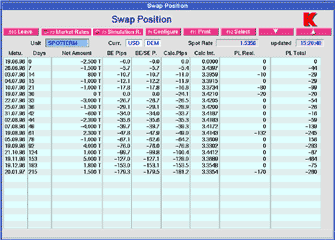 |
Picture 15: Swap Position |
 |
|
 |
|
Here all (open and closed) swap positions for a currency pair are visible. The shown table layout can be individually configured from a large choice of possible column contents, e.g. breakeven pips. market pips and interest rates, evaluated spot effect, realised and potential P/L. Pressing a function key toggles between the usage of realtime market rates or user defined simulation rates as base of the calculations. |
|
 |
3.2.3. Deposit/Loan |
 |
|
Overview of all current money market deals at a given date. |
|
 |
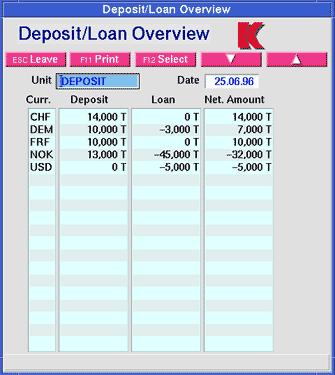 |
Picture 16: Deposit/Loan Position Overview |
 |
|
 |
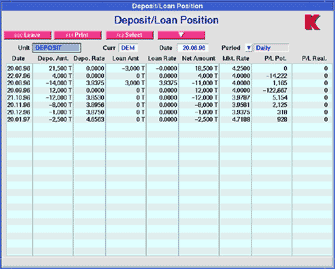 |
Picture 17: Deposit/Loan Position |
 |
|
 |
|
Forward overview of all money market contracts for a given currency. The column layout is configurable, the example shows realised and potential P/L et.al. The forward positions can be shown daily as well as weekly or monthly accumulated. |
|
 |
3.2.4. General Position Screens |
 |
|
Liquidity Overview regarding one currency. Also here the column layout as well optional accumulation per week or month are adjustable. |
|
 |
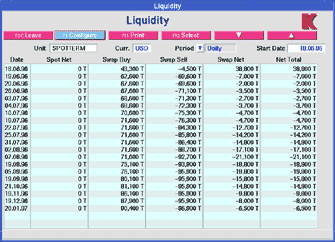 |
Picture 18: Liquidity |
 |
|
 |
|
Cashflow by instruments and total sum. Also here weekly or monthly accumulation and table layout are configurable. |
|
 |
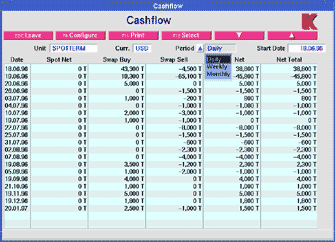 |
Picture 19: Cashflow |
 |
|
 |
|
The screen below regards all open positions for a single business day, separated by currencies. This view of currency positions does not take into consideration the currency pairs used by FX deals. So a more flexible view especially when doing intense cross trading is possible.
The user can choose the shown instruments ( Spot/Outright, Swap, Deposit/Loan), the value date as well as the reference currency used for the calculations. The third column displays the up-to-date market rate (spot or forward), the last row shows potential P/L.
The last two columns display user defined simulation rates and a position evaluation based on these rates. This screen will be updated automatically. |
|
 |
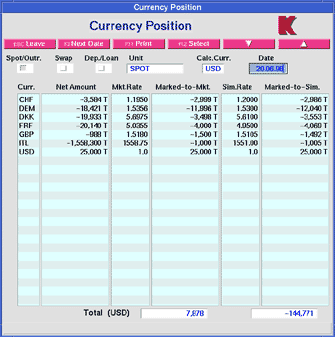 |
Picture 20: Currency Positions |
 |
|
 |
 | |  | |  |
|
| |